سرعت یافتن دلارزدایی در مبادلات تجاری ایران
با پیوستن ایران به بانک بریکس و استفاده از ارز مشترک این ائتلاف، امکان انجام مبادلات تجاری خارج از چارچوب دلار آمریکا فراهم میشود. این اقدام نه تنها ظرفیت ارزی کشور را افزایش میدهد، بلکه وابستگی اقتصاد ایران به نوسانات و بحرانهای مالی آمریکا، بهویژه افزایش نمایی بدهیهای دولت فدرال، کاهش مییابد. در نتیجه، ایران در برابر تکانههای اقتصادی ناشی از بحرانهای دلارمحور، آسیبپذیری کمتری خواهد داشت.

به تصویر زیر نگاه کنید:
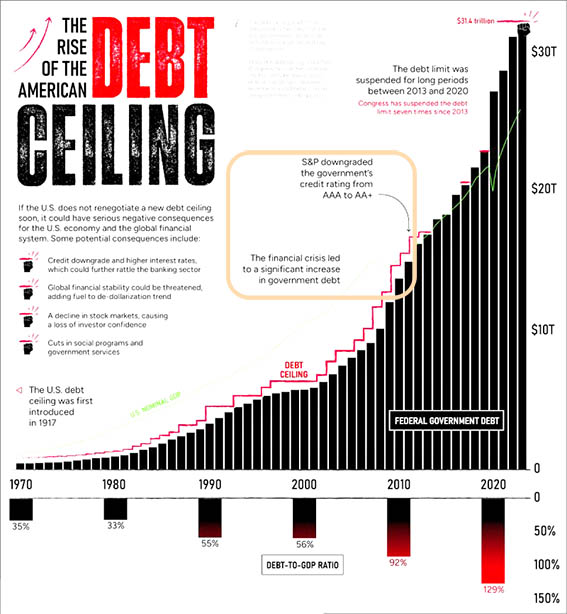
این تصویر به تحلیل «افزایش سقف بدهی آمریکا» میپردازد و نشان میدهد که چگونه بدهی دولت فدرال آمریکا از سال 1970 تاکنون رشد کرده است. در محور عمودی سمت راست، مجموع بدهی فدرال (تا 30 تریلیون دلار) و در محور افقی، سالها از 1970 تا حوالی 2023 مشخص شدهاند.
تحلیل بخش مربوط به "S&P":
در میانه تصویر متنی آمده است:
> "S&P downgraded the government’s credit rating from AAA to AA+"
ترجمه:
شرکت «Standard & Poor's» یا به اختصار «S&P»، رتبه اعتباری دولت آمریکا را از AAA به AA+ کاهش داد.
تحلیل این جمله:
AAA بالاترین رتبه اعتباری ممکن است و نشاندهنده ریسک بسیار پایین برای بازپرداخت بدهی است.
AA+ یک درجه پایینتر از AAA است، و به معنای ریسک کمی بیشتر نسبت به AAA است، ولی همچنان رتبه بسیار خوبی است.
این تنزل رتبه در سال 2011 اتفاق افتاد و دلیل اصلی آن افزایش نگرانیها از ناتوانی دولت آمریکا در مدیریت بدهی و سقف بدهی بود.
تاثیر این تنزل رتبه:
باعث افزایش نرخ بهره میشود، چون سرمایهگذاران برای قرض دادن پول به دولت با ریسک بیشتر، بازدهی بالاتری میخواهند.
به اعتماد عمومی و بازارها آسیب میزند.
میتواند باعث افت بازارهای مالی و بیثباتی اقتصادی شود.
---
سقف بدهی چیست؟
در بالای تصویر تعریف شده:
"The debt ceiling is a limit on the amount of money that the U.S. government can borrow to fund its operations and pay its obligations."
ترجمه:
سقف بدهی، حداکثر مقدار پولی است که دولت آمریکا میتواند برای تأمین هزینههای خود و پرداخت بدهیها و تعهداتش قرض بگیرد.
🧱 نمودار میلهای: افزایش بدهی دولت فدرال آمریکا
محور عمودی راست: میزان بدهی فدرال (از 0 تا بیش از 30 تریلیون دلار).
میلههای مشکی: بدهی واقعی دولت فدرال در طول زمان.
خط قرمز پلهای: سقف بدهی (Debt Ceiling) که هرچند وقت یک بار افزایش داده شده.
خط سبز: تولید ناخالص داخلی اسمی آمریکا (GDP Nominal).
نکات مهم:
افزایش ناگهانی بدهی در سالهای بحران مالی (2008) و پاندمی کرونا (2020 به بعد) دیده میشود.
بین 2013 تا 2020 سقف بدهی موقتاً تعلیق شد (Debt Limit Suspension)؛ این باعث شد که خط قرمز پلهای متوقف شود، اما بدهی همچنان افزایش یافت.
تا سال 2023، بدهی به 31.4 تریلیون دلار رسیده است.
📉 نسبت بدهی به تولید ناخالص داخلی (Debt-to-GDP Ratio)
در پایین تصویر، نسبت بدهی به GDP از سال 1970 تا کنون نشان داده شده:
1970: حدود 35%
1990: حدود 55%
2010: حدود 92%
2022: حدود 129%
🔻 نکته کلیدی:
افزایش این نسبت نشانهای از ناپایداری مالی است. هرچه این عدد بزرگتر باشد، توانایی دولت برای پرداخت بدهیها کمتر به نظر میرسد.
⚠️ پیامدهای عدم افزایش سقف بدهی
سمت چپ تصویر فهرستی از پیامدهای احتمالی را نشان میدهد اگر کنگره سقف بدهی را افزایش ندهد:
تنزل رتبه اعتباری و افزایش نرخ بهره → بانکها آسیب میبینند.
تهدید به بیثباتی جهانی مالی → افزایش روند دلاریزدایی (De-dollarization).
افت بازارهای سهام → کاهش اعتماد سرمایهگذاران.
کاهش خدمات دولتی و برنامههای اجتماعی.
📉 مثال واقعی: تنزل رتبه اعتباری توسط S&P (سال 2011)
شرکت رتبهبندی اعتبار S&P برای اولین بار در تاریخ، رتبه اعتباری آمریکا را از AAA به AA+ کاهش داد.
دلیل:
بحران سیاسی بر سر افزایش سقف بدهی و نگرانی از احتمال نکول (default) دولت آمریکا در پرداخت تعهداتش.
📊 جمعبندی تصویری:
عنصر کلیدیتوضیحسقف بدهی (Debt Ceiling)محدودیتی برای استقراض دولتخط قرمز پلهایمیزان سقف بدهی مصوب توسط کنگرهمیلههای سیاهبدهی واقعی دولت فدرالخط سبزتولید ناخالص داخلی آمریکا2013–2020دوره تعلیق سقف بدهی31.4 تریلیون دلارمیزان بدهی تا سال 2023129%نسبت بدهی به GDP در حال حاضر
📌 نتیجهگیری نهایی
تصویر نشان میدهد که:
بدهی دولت آمریکا در دهههای اخیر بهشدت افزایش یافته.
نسبت بدهی به تولید ناخالص داخلی به سطوح نگرانکنندهای رسیده.
بحرانهای اقتصادی و سیاسی تأثیر بزرگی بر افزایش این بدهی داشتهاند.
اگر سقف بدهی بهموقع افزایش نیابد، پیامدهای داخلی و بینالمللی خطرناکی به همراه دارد.
_____________________
By joining the BRICS Bank and using the alliance's common currency, Iran will be able to conduct trade outside the US dollar. This will not only increase the country's foreign exchange capacity, but also reduce the dependence of the Iranian economy on US financial fluctuations and crises, especially the exponential increase in federal government debt. As a result, Iran will be less vulnerable to economic shocks caused by dollar-based crises.
BRICS Credit Card
See the image below:
US Debt with Exponential Graph
This image analyzes the "US Debt Ceiling Increase" and shows how the US federal government's debt has grown since 1970. The vertical axis on the right shows the total federal debt (up to $30 trillion) and the horizontal axis shows the years from 1970 to around 2023.
Analysis of the section related to "S&P":
In the middle of the text image, it says:
> "S&P downgraded the government’s credit rating from AAA to AA+"
Translation:
Standard & Poor's, or "S&P", lowered the credit rating of the US government from AAA to AA+.
Analysis of this sentence:
AAA is the highest possible credit rating and indicates a very low risk of debt repayment.
AA+ is one notch below AAA, and means a slightly higher risk than AAA, but still a very good rating.
This downgrade occurred in 2011 and the main reason was increasing concerns about the US government's inability to manage its debt and the debt ceiling.
The impact of this downgrade:
It causes interest rates to rise, as investors want a higher return to lend money to the government with greater risk.
It damages public confidence and markets.
It can cause financial market crashes and economic instability.
World Bank member countries with BRICS currencies [Click and drag to move]
---
What is the debt ceiling?
Above the image is defined:
"The debt ceiling is a limit on the amount of money that the U.S. government can borrow to fund its operations and pay its obligations."
Translation:
The debt ceiling is the maximum amount of money that the U.S. government can borrow to fund its operations and pay its obligations.
🧱 Bar chart: Increase in U.S. federal government debt
Right vertical axis: Amount of federal debt (from 0 to over $30 trillion).
Black bars: Actual federal government debt over time.
Red stepped line: Debt Ceiling that has been increased from time to time.
Green line: Nominal U.S. GDP.
Key points:
The sharp increase in debt is seen in the years of the financial crisis (2008) and the COVID-19 pandemic (2020 onwards).
Between 2013 and 2020, the debt limit was temporarily suspended; this stopped the red line from climbing, but the debt continued to rise.
By 2023, the debt had reached $31.4 trillion.
📉 Debt-to-GDP Ratio
The figure below shows the debt-to-GDP ratio since 1970:
1970: around 35%
1990: around 55%
2010: around 92%
2022: around 129%
🔻 Key point:
A rise in this ratio is a sign of financial instability. The larger this number, the less likely the government is to repay its debts.
⚠️ Consequences of not raising the debt ceiling
The left side of the image shows a list of possible consequences if Congress does not raise the debt ceiling:
Credit rating downgrade and interest rate hike → Banks will suffer.
Threat of global financial instability → Increased de-dollarization.
Stock market crash → Reduced investor confidence.
Reduced government services and social programs.
📉 Real-life example: Credit rating downgrade by S&P (2011)
For the first time in history, the credit rating agency S&P lowered the US credit rating from AAA to AA+.
Reason:
Political crisis over raising the debt ceiling and concerns about the possibility of the US government defaulting on its obligations.
📊 Visual Summary:
Key ElementExplanationDebt CeilingA limit on government borrowingRed Stepped LineDebt ceiling amount enacted by CongressBlack BarsReal Federal Government DebtGreen LineUS GDP2013–2020Debt ceiling suspension period$31.4 trillionDebt amount by 2023129%Current debt-to-GDP ratio
📌Final Conclusion
The image shows that:
US government debt has increased sharply in recent decades.
The debt-to-GDP ratio has reached alarming levels.
Economic and political crises have had a major impact on the increase in this debt.
If the debt ceiling is not raised in a timely manner, it will have dangerous domestic and international consequences.